Iowa Soil Test Levels
By: Soil View (Midwest Independent Soil Samplers, LLC)
The International Plant Nutrition Institute has recently published the Soil Test Levels in North America report. This report gives a summary of soil test results by each state for 2015 and also includes the data for the 2001, 2005 and the 2010 sampling year. We have included the chart of the Iowa results for phosphorus, potassium and soil pH that you will find interesting. This information is the result of compiling the data of 987,917 soil samples taken in 2015 from Iowa fields. It is interesting to note that the 2001 report consist of 380,265 samples, 2005 – 355,983 samples and the 2010 results are from 775,401 samples. The increase in samples taken from 2010 to 2015 is nearly a 38% increase of samples pulled in Iowa in 5 short years.
More important than the number of samples are the analytical results and the huge opportunity we have to increase yields and profits. 40% of the soil test P levels are below the critical level of 20 PPM in Iowa! IPNI defines the critical level as the soil test level below which nutrients are required to meet soil fertility management objectives. 50.6 % of the samples are below 25 PPM and 59.3% are below 30 PPM. For top producers, this means 40% of soil tests need crop removal plus a build program of phosphorus, another 10.6 % need at least crop removal and probably a build and 8-9 % may want at least crop removal to maintain around 30 PPM in productive soils under top management.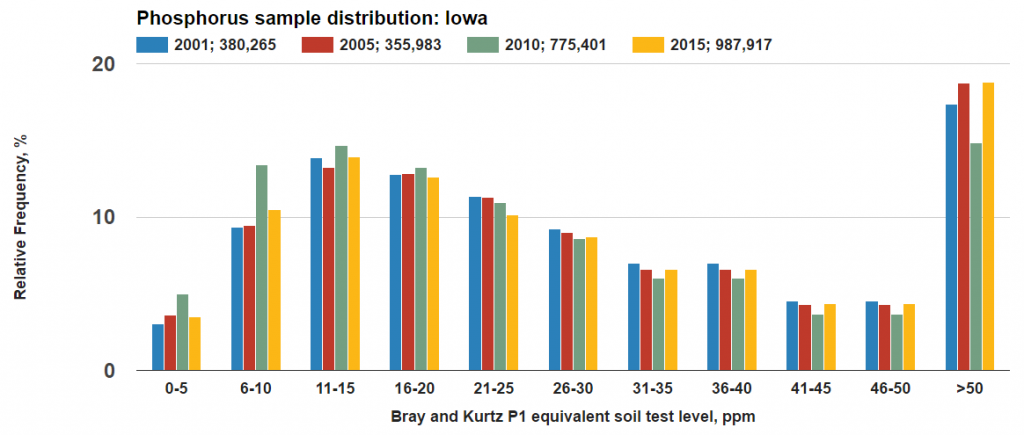
Soil test potassium levels are just as surprising. IPNI classifies K soil test values of 170 PPM and below as critical, the ISU range for optimum is now 160-200 PPM and many field trials are proving higher K level, in the 225-240 PPM range, are paying huge dividends in high yield environments. The 2015 IPNI Iowa soil test K levels show 34 % of soil test K values are 160 PPM and lower, 56.2 % of K soil test values are below 200 PPM while 68.6% are 240 PPM and below.
Soil test K values of 160 and below, 34%, need crop removal and an aggressive build program, 22.2% need a crop removal and build and another 12.4% need at least crop removal. Yes, 68.6 % need at least crop removal application of K!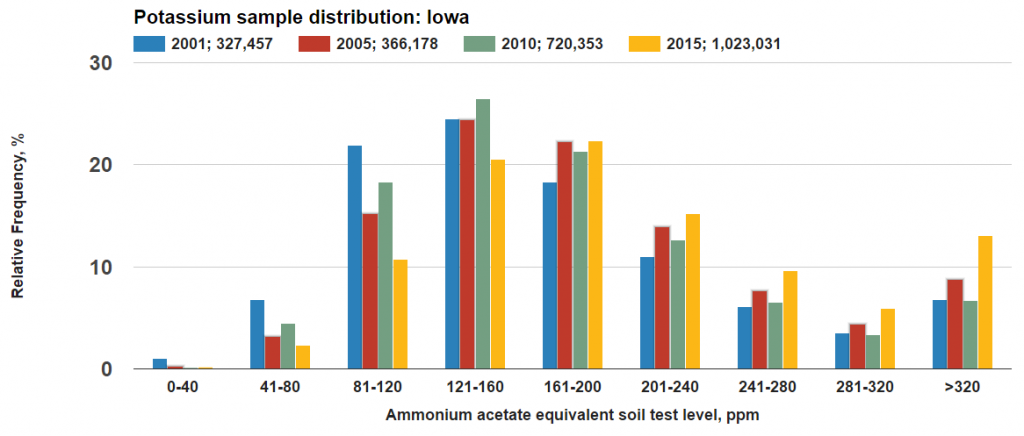
Stop for a moment and think about where these 987,917 samples are coming from? Most samples are coming from aggressive growers, already using grid soil sampling & variable rate application, and those under mandatory manure management programs which sample results in nearly every case carry very high STVs. If you haven’t been soil sampling, think about the opportunity to increase your yields!
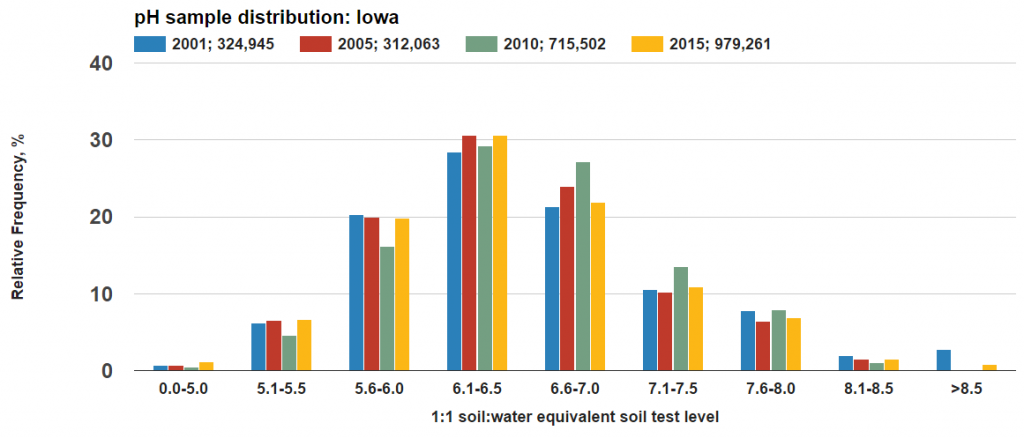
Soil pH information is also included as for many areas of Iowa acid pH’s are a critical factor in maximizing N efficiency and legume yields. Not surprising the mean pH level of the soil test taken is 6.4 for 2015. We know that many soils in Iowa have a naturally high pH that greatly influences the mean; we also know there is a great deal of spatial variation of soil pH in Iowa fields that require intensive soil sampling before lime should be applied. 27.5 % of the Iowa samples had a soil pH of 6 or less while 58.1% had a pH of 6.5 or less.
To learn how grid sampling can be valuable to your operation, chat with your Stutsman Agronomist.
Source of this material available here.